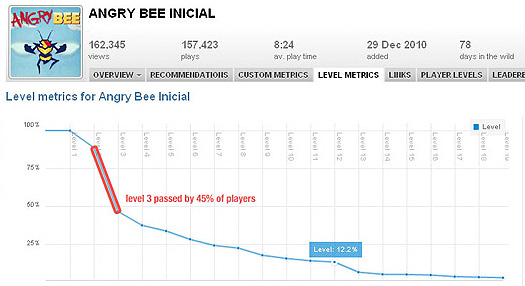
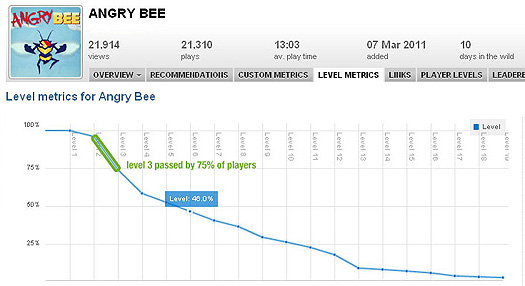
Zombie Cells – Character Design (1/2)
In the process of creating a new game/world you come to a moment when you have to settle it with inhabitants. At that moment the possibilities are overwhelming, but you must go down to earth and start placing some boundaries here and there. Once you know which kind of public the game is focusing on, and which kind of metafore would fit the game mechanics, it’s the time to call your pencil to action.
In this case, we had a liquid or low gravity environment, plus a massive spawning of beings. Once we dismiss the spacey theme, we went for the more stimulating body fluids’ setting ;). At some point the word “zombie” came out, and like victims of our time (the zombie golden-age) we just couldn’t help imagining hordes of zombie cells infecting a helpless host. In fact, we imagined the host was Justin Bieber… Down below are the first attempts.
The idea here is to try different approaches. To see which ones fit best and trace a line of action. Pencil is still the quickest tool. Although your inner child may just wish to start using colours, it’s better to try as many different styles in the less time possible, so let’s keep computer away.
OK, this time my inner child won over the battle, so I jumped quickly to Flash. That’s why the first two attempts, (down here) are just crap. Then I tried a simple cartoony style, most in the mood of Angry Birds. You can notice that specially in the last two of them.

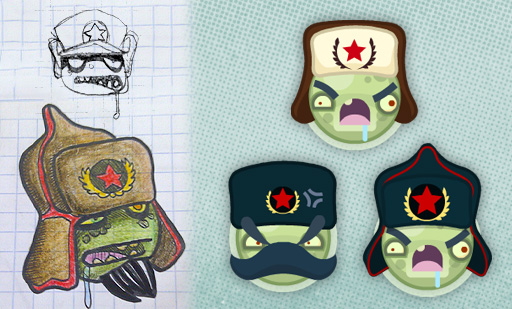
And then… the magical moment, when everyone goes crazy. At some point you may come to a mad idea, an absurd concept that may be very funny. And then again, cold miss Logic comes back and hits your face with her glove. “Did you really think that zombie cells also needed to go soviet?”. – “Uhmmm… I guess it was not necessary, but it was cool as hell”.

It’s important to go through this phase in the early stages of design, or else, this mayhem will make you waste an undefined amount of precious time. In this case we dismissed the idea due to some deep and raw concerns about disappointed expectation.
In the second post about character design we’ll reveal the final stages of zombie cells infection. Take care!


